


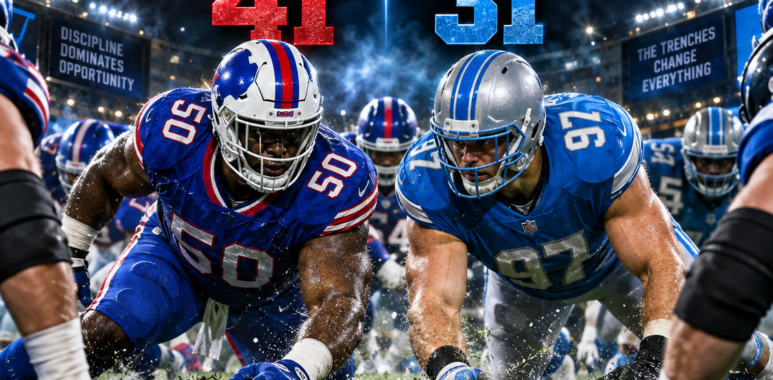
BUFFALO CONTROLS THE TRENCHES IN 41–31 THURSDAY NIGHT VICTORY OVER DETROIT
Bills’ rushing production and relentless pass rush establish the difference up front
ORCHARD PARK, N.Y. — The Buffalo Bills defeated the Detroit Lions 41–31 Thursday night, but the most revealing numbers were produced along the line of scrimmage.
Buffalo finished with 203 rushing yards while averaging 5.6 yards per carry. Detroit managed only 66 rushing yards, creating a 137-yard difference between the two rushing attacks.
That disparity demonstrated Buffalo’s ability to create movement, sustain blocks, establish running lanes and control the physical direction of the game.
Buffalo’s offensive line establishes control
The Bills’ offensive front supported an offense that accumulated 446 total yards while surrendering only two sacks.
Buffalo’s 203 rushing yards kept Detroit’s defensive front from consistently attacking in obvious passing situations. The offensive line created enough space for the Bills to remain balanced and productive throughout the game.
Detroit’s defensive front still generated:
- Two sacks
- Eight quarterback hits
- A 34.2% pressure rate
However, that pressure did not compensate for allowing Buffalo to average 5.6 yards per rushing attempt.
Rousseau and Chubb disrupt Detroit’s protection
Buffalo’s defensive front recorded four sacks and repeatedly challenged Detroit’s pass protection.
Gregory Rousseau delivered one of the strongest trench performances of the night, producing a game-high six quarterback pressures. His length, speed and continued pursuit prevented Detroit’s offensive line from consistently establishing a secure pocket.
Bradley Chubb converted disruption into production with 1.5 sacks. His ability to attack the edge and finish at the quarterback strengthened a Buffalo pass rush that remained effective despite the absence of defensive tackle Ed Oliver.
Buffalo’s defensive front also limited Detroit to 66 rushing yards, forcing the Lions to operate without dependable balance. The Bills combined run discipline with pass-rush production—the exact formula required to control an opposing offense from the defensive front.
Hutchinson provides Detroit’s strongest response
Aidan Hutchinson was Detroit’s leading trench performer, finishing with:
- One sack
- Four quarterback pressures
Hutchinson consistently created individual disruption, but Detroit’s defensive front could not collectively prevent Buffalo from controlling the running game.
The Lions recorded two sacks and generated eight quarterback hits, yet Buffalo’s offensive line continued creating productive rushing opportunities. Detroit produced pressure in isolated moments; Buffalo controlled the line of scrimmage across the complete game.
Detroit’s offensive line struggles with consistency
Detroit’s offensive front allowed four sacks and supported a rushing attack that gained only 66 yards.
The inability to establish consistent rushing production increased the pressure on Detroit’s pass protection. Buffalo could attack more aggressively without having to consistently respect the interior running game.
Detroit’s line continued competing as the game progressed, but the final trench statistics revealed the decisive difference:
- Buffalo rushed for 203 yards
- Detroit rushed for 66 yards
- Buffalo’s defense recorded four sacks
- Detroit’s defense recorded two sacks
- Buffalo allowed two sacks
- Detroit allowed four sacks
SUFRB Trench Players of the Game
Buffalo Bills
Gregory Rousseau: Six quarterback pressures
Bradley Chubb: 1.5 sacks
Detroit Lions
Aidan Hutchinson: One sack and four quarterback pressures
Final trench assessment
Buffalo won the rushing-yardage battle, produced twice as many sacks and provided more consistent protection.
Detroit generated pressure, particularly through Hutchinson, but Buffalo delivered the more complete performance on both sides of the line of scrimmage.
The final score was Buffalo 41, Detroit 31—but the game’s foundation was established where football games are routinely decided.
It All Starts Up Front™
Statistics were verified through the NFL’s official game analysis and reported team-performance data.
